Bogdan Ciocoiu - GreuceanuDescription
This indicator is an entry-level script that simplifies volume interpretation for beginning traders.
It is a handy tool that removes all the noise and focuses traders on identifying potential smart money injections.
Uniqueness
This indicator is unique because it introduces the principle of a moving average in the context of volume and then compares it with tick-based volume.
Its uniqueness is reflected in the ability to colour code each volume bar based on the intensity of each relevant (volume) unit whilst comparing it with the volume moving average.
Another benefit of this indicator is the colour coding scheme that removes volume below a particular threshold (default set to 1) under the volume moving average.
In addition to the above features, the indicator differentiates the colour of each bar by price direction.
Open source re-use
To achieve this functionality several open source indicators have been used an integrated within the current one.
Recherche dans les scripts pour "VOLUME BAR"
ShooterViz Lazy Trader EMA SystemShooterViz Lazy Trader EMA System - Complete User Guide
What This Script Does
This is a position scaling indicator that tells you exactly when to enter, add to, and exit trades using a simplified 5-EMA system. It removes the guesswork and decision fatigue from trading by giving you clear visual signals.
The Core Concept
3 entry signals that build your position from 20% → 50% → 100%
2 exit signals that scale you out at 50% → 50% (complete exit)
1 higher timeframe filter that keeps you on the right side of the trend
No Fibonacci calculations, no RSI divergence, no multi-indicator confusion. Just EMAs and price action.
What You'll See On Your Chart
1. Colored EMA Lines
Blue Lines (Entry Zone):
3 EMA (lightest blue) - Early reversal detector
5 EMA (darker blue) - Confirmation line
Green Lines (Add Zone):
21 EMA (bright green) - First add location
34 EMA (lighter green) - Final add location
Red Lines (Exit Zone):
89 EMA (lighter red) - First exit trigger
144 EMA (darker red) - Final exit trigger
Orange Lines (Hyper Frame - optional):
Hyper 21 EMA (from higher timeframe) - Trend direction
Hyper 34 EMA (from higher timeframe) - Bias confirmation
2. Triangle Signals
Green Triangles (Below Price) = BUY/ADD:
Lime triangle with "20%" = Entry 1: Price reclaimed 3→5 EMA (starter position)
Green triangle with "30%" = Entry 2: Price bounced off 21 EMA (first add)
Teal triangle with "50%" = Entry 3: Price broke out from 34 EMA compression (final add)
Red Triangles (Above Price) = SELL:
Orange triangle with "50% OFF" = Exit 1: Price broke below 89 EMA (take half off)
Red triangle with "EXIT ALL" = Exit 2: Price broke below 144 EMA (close remaining position)
3. Background Color (Trend Bias)
Light green background = Hyper frame EMAs trending up (bias LONG)
Light red background = Hyper frame EMAs trending down (bias SHORT)
Gray background = Neutral/choppy (be cautious)
4. Info Table (Top Right Corner)
A live status dashboard showing:
Which entry signals are currently active (✓ or —)
Which exit signals are currently active (⚠ or ⛔)
Current hyper frame bias (🟢 LONG / 🔴 SHORT / ⚪ NEUTRAL)
Which timeframe you're using for hyper frame filtering
How to Install and Set Up
Step 1: Add the Script to TradingView
Open TradingView
Click "Pine Editor" at the bottom of the screen
Copy the entire script code
Paste it into the Pine Editor
Click "Add to Chart"
Step 2: Configure Your Settings
Click the gear icon ⚙️ next to "LazyEMA" in your indicators list.
Critical Settings to Configure:
Hyper Frame Selection (Most Important!)
Location: "Hyper Frame (Pick ONE)" section
Setting: "Timeframe"
What to choose:
Trading 15min or 1H charts? → Use "240" (4-hour)
Trading 4H or Daily charts? → Use "D" (Daily)
Trading Daily or Weekly charts? → Use "W" (Weekly)
Why this matters: This filter keeps you aligned with the bigger trend. Only take longs when this timeframe is green, shorts when it's red.
MA Type (Optional, default is fine)
Location: "MA Config" section
Default: EMA (recommended)
Options: EMA, SMA, WMA, HMA, RMA, VWMA
Most traders should stick with EMA
Visual Toggles (Customize your view)
Entry Zone: Turn individual EMAs on/off (3, 5, 21, 34)
Exit Zone: Turn individual EMAs on/off (89, 144)
Hyper Frame: Toggle the higher timeframe EMAs on/off
Step 3: Clean Up Your Chart
Turn OFF these if visible:
Volume bars (they clutter the view)
Any other indicators you have loaded
Grid lines (optional, but cleaner)
Keep ONLY:
Price candles
Your ShooterViz Lazy Trader EMA System
Maybe support/resistance levels if you manually draw them
How to Trade With This Script
The Basic Workflow
Before the Market Opens:
Check the background color and info table bias
Green background? Look for LONG setups only
Red background? Look for SHORT setups only
Gray background? Stay flat or trade small
During the Trading Session:
LONGS (When hyper frame is bullish):
Wait for Entry 1 signal:
Lime triangle appears with "20%"
Price has reclaimed the 5 EMA after dipping to 3 EMA
Action: Enter 20% of your intended position
Stop loss: Place below the 5 EMA or recent swing low
Wait for Entry 2 signal:
Green triangle appears with "30%"
Price pulled back to 21 EMA and bounced
Action: Add 30% more (you're now at 50% total)
Move stop: Trail it up to below 21 EMA
Wait for Entry 3 signal:
Teal triangle appears with "50%"
Price compressed at 34 EMA and broke out
Action: Add final 50% (you're now 100% loaded)
Move stop: Trail it up to below 34 EMA
Wait for Exit 1 signal:
Orange triangle appears with "50% OFF"
Price broke below 89 EMA
Action: Exit 50% of your position immediately
Move stop on rest: Trail to 89 EMA or lock in profits
Wait for Exit 2 signal:
Red triangle appears with "EXIT ALL"
Price broke below 144 EMA
Action: Exit remaining 50% (you're now flat)
Or: Stop gets hit at 89 EMA (same result)
SHORTS (When hyper frame is bearish):
Same process, but inverted
Triangles appear above price instead of below
Look for breakdowns below EMAs instead of bounces off them
Exit when price reclaims 89 and 144 EMAs
Real-World Example Walkthrough
Setup: Trading ES (S&P 500 Futures) on 1H Chart
Chart Configuration:
Timeframe: 1 Hour
Hyper Frame: 240 (4-hour)
Ticker: ES
Pre-Market Check:
Background is light green
Info table shows "🟢 LONG" for Hyper Bias
Decision: Only look for long entries today
9:30 AM - Market Opens
Price dips and touches 3 EMA
Watch for: Reclaim of 5 EMA
9:45 AM - Entry 1 Triggers
Lime triangle appears below bar
Price closed above 5 EMA at $4,550
Action taken:
Enter long 20% position (2 contracts if targeting 10 total)
Stop loss at $4,545 (below 5 EMA)
Risk: $10 per contract × 2 = $20 risk
10:30 AM - Entry 2 Triggers
Price rallied to $4,565, pulls back
Green triangle appears at 21 EMA ($4,555)
Action taken:
Add 30% (3 more contracts, now have 5 total)
Move stop to $4,550 (below 21 EMA)
Current P/L: +$25 ($5 gain on original 2 contracts, break-even on new 3)
11:15 AM - Entry 3 Triggers
Price consolidates at 34 EMA around $4,560
Teal triangle appears as price breaks to $4,568
Action taken:
Add final 50% (5 more contracts, now have 10 total)
Move stop to $4,555 (below 34 EMA)
Current P/L: +$70
1:00 PM - Price Extends
Price rallies to $4,595 (on track)
89 EMA is at $4,575
No action yet, let it run
2:15 PM - Exit 1 Triggers
Price pulls back from $4,600
Orange triangle appears as price breaks below 89 EMA at $4,580
Action taken:
Exit 50% (5 contracts closed at $4,580)
Keep 5 contracts with stop at 89 EMA ($4,575)
Banked: +$150 average gain on closed 5 contracts
2:45 PM - Exit 2 Triggers
Price continues down
Red triangle appears as price breaks 144 EMA at $4,570
Action taken:
Exit remaining 5 contracts at $4,570
Banked: +$100 on remaining 5 contracts
Final Results:
Total gain: $250 on the trade
Initial risk: $50 (if stopped out at Entry 1)
Risk/Reward: 5:1
Time in trade: ~5 hours
Common Questions
"What if I miss Entry 1? Can I still take Entry 2?"
Yes! Each entry is independent. If you miss the 3→5 reclaim, wait for the 21 EMA bounce. You'll start with a 30% position instead of 20%, but that's fine.
Rule: Never chase. Wait for the next EMA setup.
"What if multiple entry signals trigger at the same bar?"
Rare, but possible. If you see both Entry 1 and Entry 2 trigger together:
Take Entry 1 first (20%)
If the next bar confirms Entry 2 is still valid, add 30%
When in doubt, scale in gradually
"The hyper frame is green but I'm seeing short signals?"
Don't take them. The hyper frame is your bias filter. If it says "go long," ignore short setups. They're usually lower probability and will get stopped out.
"Can I use this for swing trading overnight?"
Absolutely. Just switch your hyper frame:
If you're on Daily charts, use Weekly hyper frame
If you're on 4H charts, use Daily hyper frame
Adjust position sizes for overnight risk
"What if the signal appears right at market close?"
Don't chase it. Wait for the next bar (next day) to confirm. Signals that appear in the last 5 minutes are often noise.
"How do I set up alerts?"
Right-click on the chart
Select "Add Alert"
Choose "LazyEMA" from the condition dropdown
Select which signal you want alerts for:
Entry 1: 3→5 Reclaim
Entry 2: 21 EMA Add
Entry 3: 34 EMA Breakout
Exit 1: 89 EMA Break
Exit 2: 144 EMA Break
Click "Create"
Pro tip: Set up all 5 alerts so you never miss a signal.
Position Sizing Guide see
swingtradenotes.substack.com
Critical Rule: Know your total risk BEFORE you take Entry 1. Don't wing it.
Customization Tips
For Day Traders (Scalpers)
Use 5min or 15min charts
Hyper frame: 1H or 4H
Expect 2-4 setups per day
Tighter stops (0.5% risk per entry)
For Swing Traders
Use 4H or Daily charts
Hyper frame: Daily or Weekly
Expect 1-2 setups per week
Wider stops (1-2% risk per entry)
For Position Traders
Use Daily or Weekly charts
Hyper frame: Weekly or Monthly
Expect 1-2 setups per month
Widest stops (2-3% risk per entry)
The "Don't Be Stupid" Checklist
Before taking ANY signal from this script, ask:
✅ Is the hyper frame bias pointing in my direction?
✅ Is the signal clean (not at a weird time or during news)?
✅ Do I know my stop loss level?
✅ Do I know my position size?
✅ Can I afford to lose if this trade fails?
If you answered "no" to ANY of these, skip the trade.
Troubleshooting
"I'm not seeing any signals"
Possible causes:
The "Show Lazy Trader System" toggle is off (turn it on)
Your chart timeframe is too high (try 1H or 4H)
Market is in a tight range (EMAs are compressed)
You need to refresh the chart
"Too many signals, getting whipsawed"
Fixes:
Increase your chart timeframe (go from 15m to 1H)
Switch to a less volatile ticker
Only trade when hyper frame bias is STRONG (not neutral)
Add a minimum bar count between signals
"The info table is covering my price action"
Fix:
Edit the script
Find the line: table.new(position.top_right, ...
Change position.top_right to position.bottom_right or position.top_left
"Signals appear then disappear"
This is normal (repainting). Some signals (especially compression breakouts) can disappear if the next bar reverses. This is why you:
Wait for bar close before acting
Use alerts that only fire on confirmed bars
Don't chase signals mid-bar
Final Thoughts
This script is a decision-making tool, not a crystal ball. It shows you high-probability setups based on EMA dynamics and trend structure. You still need to:
Manage your risk
Choose your position size
Stick to the rules
Accept losses when they happen
The system works when YOU work the system.
Print this guide, tape it next to your monitor, and follow it religiously for 20 trades before making ANY changes.
Good luck, and stay lazy (the smart way).

Volume (Custom Timeframe & Color)This indicator displays volume data from a custom timeframe, regardless of the current chart resolution.
The bar color is determined by the price movement of the selected timeframe (green for bullish, red for bearish).
Features:
- Select any custom timeframe for volume (e.g., 5m, 15m, 1h, 1D).
- Volume bars are painted according to the candle direction of that timeframe.
- Useful for multi-timeframe analysis and detecting higher timeframe volume trends.
Inspired by TradingView’s built-in Volume indicator, but enhanced with custom timeframe and consistent coloring.

ATR Price Targets w/POC
ATR Price Targets with Point of Control (POC):
This script is designed to help traders identify key price target levels based on configurable multipliers of the the Average True Range (ATR) and the volume based Point of Control (POC). It is intended for intraday traders looking to capture significant price movements.
Features:
ATR Price Targets: The script calculates three levels of price targets above and below the first bar of the day, based on the ATR of the last 22 days (assuming 5-minute candles). These targets are adjustable through the settings, allowing traders to set their own ATR multipliers.
Point of Control (POC): The POC is determined as the price level of the highest volume bar since the start time, providing an indication of the most traded price within the specified period.
Customizable Start Time: Traders can set their desired start time for the calculation of price targets and POC, allowing for flexibility in aligning the indicator with their trading strategy.
Plot Lines: The ATR price targets are plotted as lines for easy visualization on the chart.
Usage:
The ATR price targets can be used as potential take-profit or stop-loss levels.
The POC can serve as a key level for assessing market sentiment and potential reversals.
Traders can adjust the ATR multipliers and start time based on their specific trading style and market conditions.
Settings:
ATR Price Targets 1, 2, 3: Adjust the multipliers for the ATR price targets. By default, these are set to 1*ATR for T1+/T1-, 3*ATR for T2+/T2- and ATR*6 for T3+/T3-. Adjust with caution as the price targets found in defaults have proven to be more accurate over intraday cycles for volatile stocks.
Start Hour & Start Minute: Set the starting hour and minute for the calculations. By default, these are set to the opening 5 minute intraday bar, but can also be set to the opening bar of pre-market hours.

High Volume BarsThis script colors bars whenever their volume has exceeded more than a standard deviation (or multiples of it) from a given amount of bars in the past.
Volume is commonly used as confirmation for a break of a significant level, or as indicative of offside positions when a level fails to be defended. Conviction or Excess, depending on the context.

Multi MA on candlestick volume indicatorUses 5 volume moving averages to change the candlestick color depending on how high above average volume is.
The volumes plotted at the bottom of the chart are set to the same settings as the indicator, you can see the volume bars that stick higher above the orange moving average are a different color on the chart to the smaller ones.
Any volume bar that is below the moving average is colored purple.

Volume, Simple Relative Volume HighlightThis script plots volume bars and highlight bars that have an unusual activity, compare to the average (Standard: Simple Moving Average, 50 periods).
The script is useful for checking daily volume levels on equities. Where there is high volume, there is likely volatility, wich is good for day trading and swing trading entries.

VolumeZThis study show you the volume bar that are significant above the median >2 times per 5 bars
the volume bar is shown as volume/price
you can change and modify to make it better :)

POC Volume Bar (Highest Volume in Range)What the highlighted POC bar means
🔶 1. Institutional interest
A POC often identifies where big money stepped in.
🔶 2. Support or resistance pivot
Large volume often signals:
• A reversal
• A breakout
• Or the beginning of a trend
🔶 3. Liquidity magnet
Price tends to revisit high-volume bars.
They act like magnets.
🔶 4. Trend confirmation or exhaustion
High volume on:
• Green candle → bullish participation
• Red candle → distribution / aggressive selling

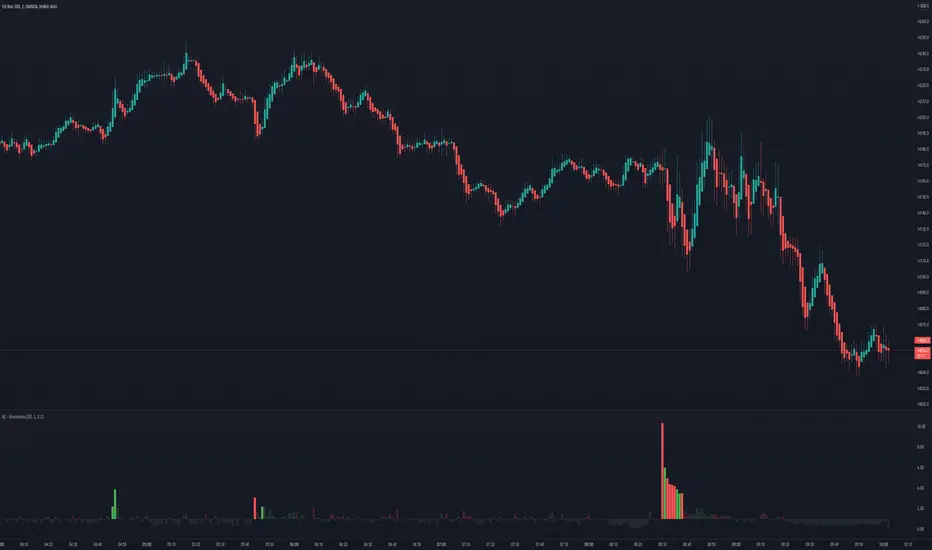
Big Orders Detector (Smart Cluster v4)The Big Orders Detector (Smart Cluster v4) is a trading indicator designed to highlight unusually large market orders and potential institutional activity directly on price charts. It identifies candles with volumes significantly above the recent average and can detect clusters of consecutive high-volume bars that may indicate accumulation or distribution by large players. The indicator visualizes these events using circles, labels with estimated monetary values, and a mini dashboard showing the current status of market activity.
Potential ways to use this indicator:
Spotting large market moves: Traders can use it to identify sudden spikes in volume that might precede significant price movements.
Monitoring institutional activity: The “Smart Cluster” feature highlights potential clusters of high-volume bars, which may suggest institutional accumulation or distribution.
Supporting trade decisions: It can serve as an additional layer of information alongside other technical analysis tools, helping traders gauge market interest and momentum.
Alert setup: Users can configure alerts for large orders or clusters to stay informed without constantly monitoring the chart.
Important considerations:
Nothing in trading is certain. This indicator highlights volume anomalies and potential clusters, but it does not guarantee profits or predict market direction.
Trading always involves risk, including the loss of capital. Use this indicator as a supplementary tool rather than a standalone strategy.
Proper risk management, position sizing, and confirmation from other analyses are essential when making trading decisions.
In essence, this tool is for information and insight, helping traders observe where significant market activity occurs, while emphasizing caution and the inherent uncertainty of financial markets.

Volume Based S/RI got a question if it would be possible to Automatically draw S/R levels based on Volume rather than RSI as I had earlier done in this script;
Well it certainly is and it looks as though it might even be tradeable.
The indicator compares the size of volume bars so that if there is a noticeable increase in volume (noticeable here meaning above the indicator threshold) it marks the bar high and low prior to the bigger volume candle.

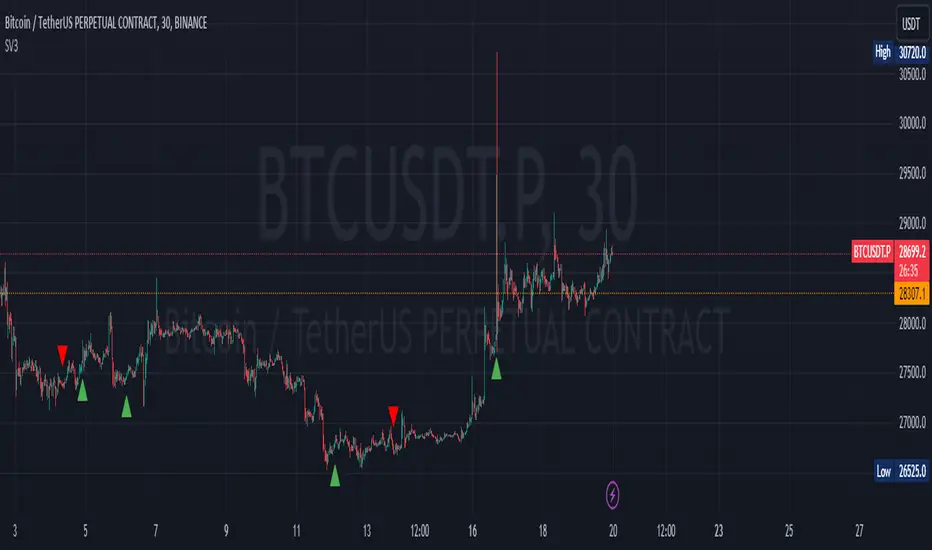
Sequence Volume BarsThis script in TradingView is designed to identify sequences of bars with increasing volume. It creates two indicators: one for bullish trends (green sequence) and another for bearish trends (red sequence).
Green Sequence: The script considers a green sequence when the current closing price is higher than the previous one, and the volume is increasing. When the green sequence approaches a user-defined length, it highlights it on the chart with a green triangle below the bar.
Red Sequence: Similarly, the script looks for a bearish sequence when the current closing price is lower than the previous one, and the volume is increasing. When the red sequence approaches the specified length, it highlights it with a red triangle above the bar.
Both indicators can also send alerts when their respective sequences reach the specified length minus one. This script can be useful for traders seeking entry points based on specific volume patterns in the market.
P.S. I'm not sure how this can be useful to you, but sometimes a pump and dump can be predicted. Maybe you'll come up with ideas on how to refine this concept.
-----------
Этот скрипт для TradingView предназначен для выявления последовательностей баров с ростом объема. Он создает два индикатора: один для бычьих трендов (зеленая последовательность) и другой для медвежьих трендов (красная последовательность).
Зеленая последовательность: Скрипт считает, что происходит зеленая последовательность, если текущая цена закрытия выше предыдущей, а объем увеличивается. Когда зеленая последовательность по длине приближается к заданной пользователем, он выделяет это на графике зеленым треугольником под баром.
Красная последовательность: Аналогично скрипт ищет медвежью последовательность, когда текущая цена закрытия ниже предыдущей, а объем растет. Когда красная последовательность приближается к указанной длине, он выделяет это красным треугольником над баром.
Оба индикатора могут также отправлять предупреждения, когда соответствующая последовательность достигает заданной длины минус один. Этот скрипт может быть полезен для трейдеров, ищущих входные точки, основанные на определенных шаблонах объема в рынке.
Не знаю как вам может это пригодиться, но иногда предсказывается пам и дамп. Может у Вас появится идея как доработать эту идею
Tick Profile HeatmapThis is a market internal TICK heatmap with the intent of displaying areas of price associated to stronger reactions with NYSE TICK (by default).
This code is based off of a variation of a Volume Profile coded originally by colejustice who originally used code from LuxAlgo . The full-width volume bars that colejustice setup were replaced with full-width bars representative of TICK breaking +/- $500, the current cumulative value representing the "heat" is comprised of hlc3 by default but that can be changed. In a future update I may add additional logic here to capture highs and lows in the heatmap specifically, and perhaps additional colors.
As with other traditional profiling studies, this indicators purpose is to visualize correspondence to specific price levels, allowing rapid assessment where the most TICK activity is occurring, and where it hasn't been. This information may provide areas of support and resistance and regions where price may move quickly repeatedly.
All of the same input guidance that colejustice provided is the same for those pre-existing inputs:
Inputs are set up such that you can customize the lookback period, number of rows, and width of rows for most major timeframes individually. Timeframes between those available will use the next lower timeframe settings (e.g., 2m chart will use the 1m settings.)
Zero usage of volume is present in this indicator, only TICK data so please don't confuse it with volume studies.

Gaussian Fisher Transform Price Reversals - FTRHello Traders !
Looking for better trading results ?
"This indicator shows you how to identify price reversals in a timely manner." John F. Ehlers
Introduction :
The Gaussian Fisher Transform Price Reversals indicator, dubbed FTR for short, is a stat based price reversal detection indicator inspired by and based on the work of the electrical engineer now private trader John F. Ehlers.
The Fisher Transform :
It is a common assumption that prices have a gaussian / normal probability density function(PDF), i.e. a sample of n close prices would be normally distributed if the probability of observing a price value say at any given standard deviation range is equal to that probability in the case of the normal distribution, e.g. 68% off all samples fell within one standard deviation around the mean, which is what we would expect if the data was normal.
However Price Action is not normally distributed and thus can not be conventionally interpreted in this way, Formally the Fisher Transform, transforms the distribution of bounded ranging price action (were price action takes values in a range from -1 to 1) into that of a normal distribution, alternatively it may be said the Fisher Transform changes the PDF of any waveform so that the transformed output has n approximately Gaussian PDF, It does so through the following equations. taken directly from the work of John F. Ehlers - Using The Fisher Transform
By substituting price data in the above formulas, bounded ranging price actions (over a given user defined period lookback - this determines the range price ranges in, see the Intermediate formula above) distribution is transformed to that in the normal case. This means when the input, the Intermediate ,(the Midpoint - see formula above) approaches either limit within the range the outputs are greatly amplified, this amplification accentuates /puts more weight on the larger deviations or limits within the range, conversely when price action is varying round the mean of the range the output is approximately equal to unity (the input is approximately equal to the input, the intermediate)
The inputs (Intermediates) are converted to normal outputs and the nonlinear Transfer of the Fisher Transform with varying senesitivity's (gammas) can be seen in the graph / image above. Although sensitivity adjustments are not currently available in this script (I forgot to add it) the outputs may be greatly amplified as gamma (the coefficient of the Fisher Transformation - see Fish equation) approaches 1. the purple line show this graphically, as a higher gamma leads to a greater amplification than in the standard case (the red line which is the standard fisher transformation, the black plot is the Fish with a gamma of 1, which is unity sensativity)
Reversal plots and Breakouts :
- Support lines are plotted with their corresponding Fish value when there is a crossover of the Fish and Fish SMA <= a given standard deviation of Fish
- Resistance lines are plotted with their corresponding Fish value when there is a crossunder of the Fish and Fish SMA >= a given standard deviation of Fish
- Reversals are these support and resistance line plots
Breakouts and Volume bars :
Breakouts cause the reversal lines to break (when the high/low is above the resistance/support), Breakouts are more "high quality" when they occur conditional on high volume, the highlighted bars represent volume standard deviations ranging from -3 to 3. When breakouts occure on high volume this may be a sign of the continutaion of the trend (reversals would signify the start of a new trend).
Hope you enjoy, Happy Trading !
(be sure to rocket the script if you liked it, this helps me know which of my scripts are the most useful)

Volume & Highlights
Large or small volume bars are highlighted.
Normal bars are using the same colors as the built-in volume indicator.

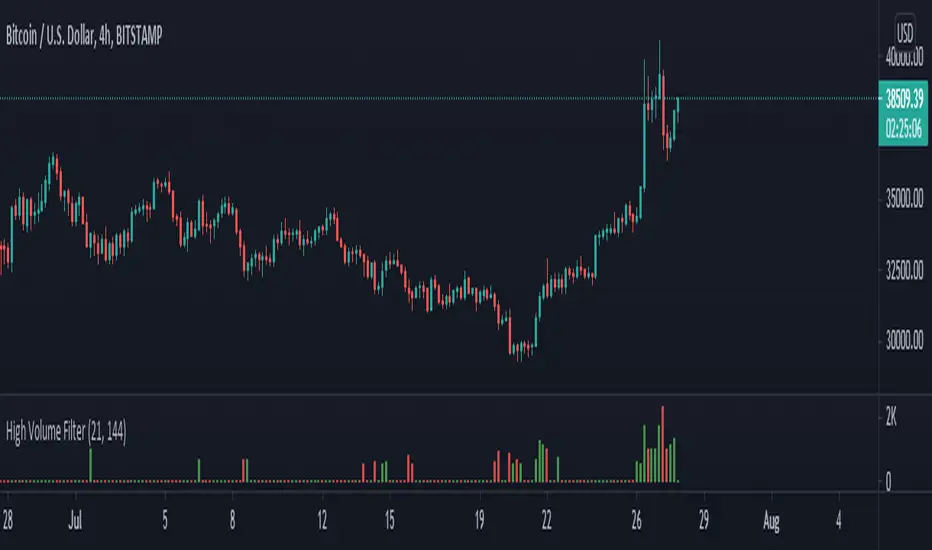
High Volume Filter - Taylor V1High Volume Filter
- Hide Small Volume Bar
- Show High Volume Bar
Able to Change the Filter Average Period
TGFA Flexible Alerts Multi-MA CrossoversTGFA Flexible Alerts, Multi-MA Crossovers
Description
Flexible MA crossovers with BUY/SELL alerts, customizable candle colors, and an info box for ATR/volatility insights. Supports EMA/SMA/HMA/VWAP on any chart.
Overview
TGFA Flexible Alerts is a versatile Pine Script indicator for traders seeking customizable moving average (MA) crossovers, visual signals, and quick-reference metrics. It overlays crossover lines (e.g., fast EMA over slow SMA), generates BUY/SELL labels and alerts, colors candles based on themes, and includes an optional info box with ATR bands, support/resistance, and trend projections. Built for any symbol and timeframe (optimized for 1H intraday), it auto-detects Heikin Ashi charts and handles mixed MA types like responsive HMA with lagging EMAs. All logic uses built-in TA functions for reliability—no repainting on confirmed bars.
Key Features
MA Crossover Engine: Configurable lines (EMA, SMA, HMA, VWAP) with dynamic colors (HMA tints green/red based on slope). Enable/disable via inputs.
Invert Signals Toggle: Flips BUY/SELL logic for mixed MA setups (e.g., HMA as fast line over EMA).
Reasoning: Traditional crossovers assume a fast line (low lag) crossing above a slow line (high lag) for buys. HMA's hull design makes it ultra-responsive, so it may "lead" too aggressively—causing premature signals. Inverting aligns it with user intuition (e.g., HMA dipping below then recovering signals strength), reducing false positives in trending markets. Test on your pairs!
Visual Alerts: BUY/SELL labels at crossover price (with optional price display and offset adjustment).
Single MA Overlays: Independent plots for EMA/SMA/HMA/VWAP (length 0 to hide).
Info Box: Real-time table with current price, ±1/2 ATR bands, median price (over lookback), trend (SMA50 slope), volatility % (ATR normalized), support/resistance (recent highs/lows), and reversal projections (tied to SMA50 pivot for up/down bias).
Candle Coloring: 20+ themes (dark/light canvases) for bull/bear/reversal/low-volume bars—e.g., Emerald Blaze greens uptrends, dims on low vol. Toggle off for no changes.
Chart Source Flexibility: Auto-switches to Heikin Ashi if detected; manual override for Regular/HA.
Alerts fire on crossovers/crossunders (custom messages with ticker/interval). Open-source for forking.
How to Use
Add to Chart: Search in TradingView's public library, apply to any symbol (e.g., stocks, forex). Best on 1H for intraday, but works on daily/weekly too.
Setup Crossovers: Choose Line 1/2 types/lengths (e.g., HMA 9 over SMA 20). Enable "Invert Signals" if using HMA—prevents lag mismatches in volatile assets.
Alerts & Labels: Toggle labels for visuals; set TradingView alerts on "Buy"/"Sell" conditions. Use offset for crowded charts.
Info Box Insights: Enable for quick scans—e.g., enter long near support if trend is bullish and price > median. Adjust ATR length (default 14) for sensitivity.
Candle Themes: Pick a scheme (e.g., Neon Pulse for dark mode); it overrides bar colors without altering data.
Customization Tip: For HMA-heavy setups, invert + short lengths (5-9) catch turns early; pair with volume filter in alerts.
Limitations & Disclaimers - Designed for overlay on price charts; may overlap in tight ranges—adjust transparency via styles.
HMA can repaint intra-bar; signals confirm on close. Not back tested for all assets—validate with strategy tester.
Info box projections use SMA(50) as a trend pivot (same for up/down as reference); customize via code for advanced calcs. Candle colors are cosmetic only.
This is an analysis tool, not advice. Trading involves risk; combine with fundamentals/news. Past performance isn't indicative of future results. No liability for losses.
I'm still a newbie, so feedback encouraged!
Thank you!!
ThisGirl

buy sell ultra systemWhat it is
EMA-POC Momentum System Ultra combines a proven trend stack (EMA 20/50/238), a price-of-control layer (POC via Bar-POC or VWAP alternative), and a momentum trigger (RSI) to surface higher-quality entries only when multiple, independent conditions align. This is not a cosmetic mashup; each component gates the others.
How components work together
Trend (EMA 20/50/238): Defines short/medium/long bias and filters counter-trend signals.
POC (Bar-POC or Alt-POC/VWAP): Locates the most-traded/weighted price area; a neutral band around POC helps avoid chop.
Control background: Above POC → buyers likely in control; below → sellers.
Momentum (RSI): Entry arrows print only when RSI confirms with trend and price location vs POC; optional “cross 50” requirement reduces noise.
Optional HTF trend: Confluence with a higher-timeframe EMA stack for stricter filtering.
Why it’s original/useful
Signals require confluence of (1) EMA trend stack, (2) POC location and neutral-zone filtering, (3) momentum confirmation, (4) optional slope and distance-to-POC checks, and (5) optional HTF trend. This reduces false positives compared with using any layer in isolation.
How to use
Markets/TFs: Built for XAUUSD (Gold) and US30. Works 1m–1h for intraday; 2h–4h for swing.
Entries:
Long: EMA stack bullish, price above POC, not in neutral band, RSI condition true → “Buy” arrow.
Short: Opposite conditions → “Sell” arrow.
Stops/Targets (suggested):
Initial stop beyond POC/neutral band or recent swing.
First target around 1R; trail with EMA20/50 or structure breaks.
Settings to tune:
POC Mode: Bar-POC (highest-volume bar’s close over lookback) or Alt-POC (VWAP).
Neutral Band %: 0.10–0.35 typical intraday.
Min distance from POC: 0.10–0.50% helps avoid low-RR entries right at POC.
RSI: Choose “cross 50” for stricter triggers or simple >/< 50 for more signals.
HTF trend: Turn on for extra confluence.
Alerts:
Buy Signal and Sell Signal (separate), or one Combined Buy/Sell alert.
Set to “Once per bar close” if you want only confirmed arrows.
Repainting / limitations
Shapes can move until bar close (standard Pine behavior) when using intrabar conditions; final confirmation at close. No system guarantees profitability—forward test and adapt to your market/instrument.
Clean chart
The published chart contains only this script so outputs are easy to identify.
Versions / updates
Use Publish → Update for minor changes; do not create new publications for small tweaks. If you fork to preserve older behavior, explain why and how your fork differs.
Changelog
v1.1 – Tuning for Gold/US30, neutral-band & distance filters, optional HTF trend, combined alert.
v1.0 – Initial public release (EMA stack + POC modes + RSI + alerts).
License & credits
Open-source for learning and improvement. Please credit on forks and explain modifications in your description.

9 EMA Retracement Buy/Sell + Volume FilterFor all you scalpers out there this is a 9 ema scalp Indicator coupled with volume bars, the Indicator plots buy and sell when the conditions are met
Price mist be above or below the 9 ema it must retrace and the volume bar must match the direction of the candle and then a signal will be printed with a red or green triangle, do not blindly take all trades on the signals make sure the is a trend works on any asset and remember it is for scalping only

Volume Bubbles 📊 Volume Bubbles Pro — Visualize Candle Volumes as Elegant Bubbles
Tired of squinting at volume bars below your chart?
Introducing Volume Bubbles Pro — a sleek, intuitive indicator that displays each candle’s trading volume as transparent colored bubbles directly on your price chart. No more switching tabs — critical volume data is now right where you need it!
✨ Key Features:
🔹 Smart Volume Classification:
Each bubble’s size reflects the strength of volume:
→ Tiny — Below average
→ Normal — Above average
→ Large — Exceptionally high (fully customizable)
🔹 Flexible Bubble Placement:
Choose to display bubbles under, over, or centered on candles — tailor it to your workflow.
🔹 Two Color Schemes:
→ Single Color — Minimalist, clean look for distraction-free charts
→ Volume-Based Gradient — Tiny = Blue, Normal = Orange, Large = Red
🔹 Optional Info Panel:
Displays real-time thresholds for “medium” and “large” volume levels directly on your chart.
🔹 Interactive Tooltips:
Hover over any bubble to see exact volume value, average volume, and volume-to-average ratio.
🔹 Built-in Alerts:
Get notified instantly when a candle registers abnormally high volume — perfect for catching breakouts or reversals.
⚙️ Fully Customizable Settings:
Average Volume Period — baseline for comparison (default: 50)
Medium Volume Multiplier — threshold to classify volume as “medium”
Large Volume Multiplier — threshold to classify volume as “strong”
Transparency — adjust opacity so bubbles enhance, not clutter
Bubble Position — under, over, or centered on candles
Color Scheme — match your chart style or strategy needs
💡 How to Use It?
Spot Key Moments: Large red bubbles often signal breakout starts, reversals, or liquidity tests.
Confirm Signals: Strong volume under a candle validates signals from other indicators.
Filter Noise: Ignore tiny bubbles — low activity means low conviction.
Scan History: Instantly identify past high-volume events across any timeframe or asset.
✅ Why Traders Love It:
✔️ Clean, uncluttered visuals — only what matters
✔️ Works on all assets & timeframes — stocks, crypto, forex, futures
✔️ Fully customizable — make it yours
✔️ Perfect for scalpers, day traders, and swing traders alike
📌 Created by:
“Volume is money voting. Let it speak to you through bubbles.”
📌 Add this tool to your arsenal — and never miss a significant volume pulse again!
💡 Pro Tip: Enable alerts to get notified about unusual volume spikes — even when you’re away from your charts.

High Volume AlertThe High Volume Alert Script is developed for all traders focusing on volume analysis in their trading strategies, providing alerts for unusually high trading volumes during specified trading sessions.
Functionality:
Volume Moving Average Calculation:
Average Volume = Moving Average(Volume) = Sum of last the x last candles Volume
Where n is the user-defined period for the moving average calculation (denoted as movingaverageinput in the script. This moving average serves as the baseline to compare current volume levels against historical averages.
High Volume Detection:
HighVolume = CurrentVolume >= (MA(Volume) x HighVolumeRatio)
Here, HighVolumeRatio is a user-defined multiplier that sets the threshold for what is considered high volume. If the current volume exceeds this threshold (the product of the moving average of volume and the HighVolumeRatio ), the script identifies this as a high-volume event.
Session Filtering:
The script further refines these alerts by ensuring they only trigger during the specified trading session, enhancing relevance for traders interested in specific market hours. This session is defined by the sess and timezone parameters.
Visualisation and Alerts:
If high volume is detected (HighVolume = True), the script colors the volume bar with the highVolumeColor . If the option is selected, it also changes the color of the candlestick to either highVolumeCandleColorUp (for bullish candles) or highVolumeCandleColorDown (for bearish candles), depending on the price movement within the high-volume period. An alert is generated through the alertcondition function when high volume is detected during the specified session, notifying the trader of potentially significant market activity.
Application in Trading:
This indicator serves traders who prioritize volume as a leading indicator of potential price movement. High trading volumes may indicate the presence of significant market activity, often associated with events like news releases, market openings, or large trades, which can precede price movements.
Originality and Practicality:
This script is self-developed, aiming to fill the gap in automatic ratio adjusted volume alerts within the TradingView environment.
Conclusion:
The High Volume Alert Script is an essential tool for traders who integrate volume analysis into their strategy, offering tailored alerts and visual cues for high volume periods.
Compliance and Limitations:
The script complies with TradingView scripting standards, ensuring no lookahead bias and maintaining real-time data integrity. However, its utility depends on the availability on volume data, and please be aware that forex pairs never offer real volume data, this tool is best used with a exchange traded symbol.
Traders Reality PVSRA Volume SuitePVSRA volume bars color coded to PVSRA vector candles and with override option and configurable moving average.
Indicator displays volume bars color coded to PVRSA price action and allows the user to override the chart symbol.
Developed for TradersReality by infernixx with library conversion by peshocore.
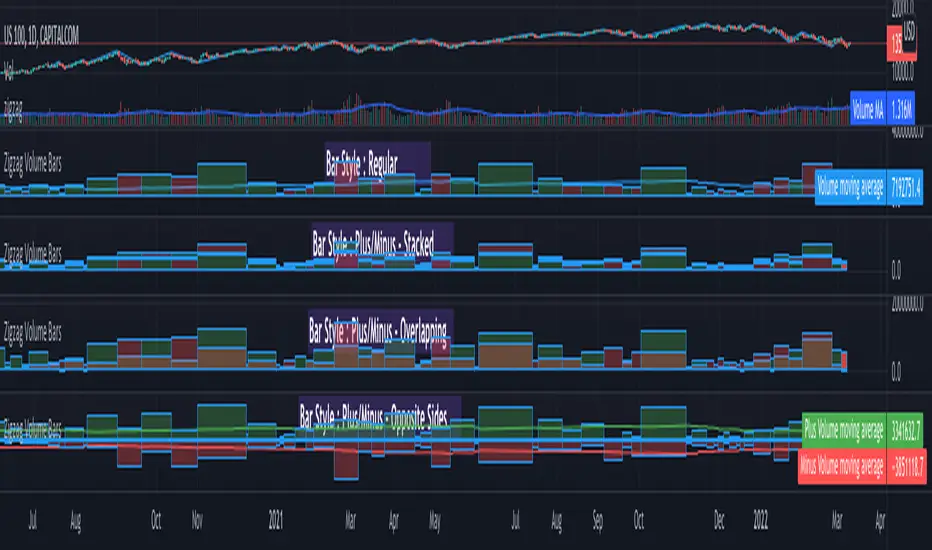
Zigzag Volume BarsBack to my favourite topic - Zigzags.
Here is an indicator which can help you visualise volume data on Zigzag swing highs and lows.
Settings are pretty simple and provides variety of display options
Display options are as demonstrated in the chart has following main types.
Regular
Plus/Minus - Stacked
Plus/Minus - Overlapping
Plus/Minus - Opposite Sides
Apart from the main display types, stacked display has several sub-types which determine whether to place green bar below red or the other way around.
Snapshot below shows example of each type.